
Publication
What M&A trends will transform the 2024 insurance landscape?
It is widely accepted that 2023 was one of the worst years in recent memory for M&A activity.
Global | Publication | December 2017
by Brandon Charles and Laura Norin, with MRW & Associates, LLC in Oakland, California
Prices for greenhouse gas emission allowances under the California cap-and-trade program have rebounded in 2017. Legal and regulatory uncertainties that had cast a shadow over the program’s future in 2016 have generally been resolved or are in the process of being addressed.
Furthermore, regulatory changes have been made to support a more robust allowance market, both in the near-term and into the future.
Although additional potential changes to the program remain under consideration, developments over the course of 2017 have clarified the future program structure.
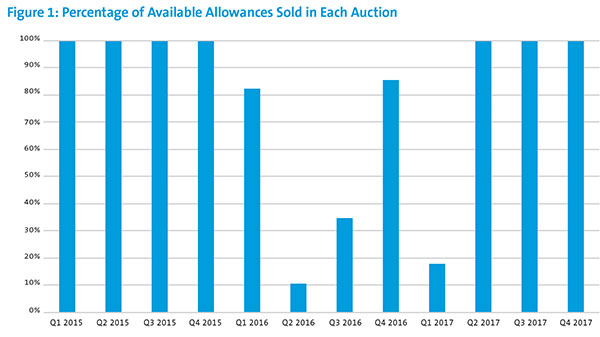
In 2016, a surplus of allowances in the market, combined with uncertainty over the future of the program, limited trading and kept prices low. In the quarterly state-run auctions for greenhouse gas allowances, just 52% of the allowances that were up for bid in 2016 and in the first auction of 2017 were sold, with fewer than 20% of available allowances sold in two of these auctions.
In contrast, in each of the subsequent three auctions, all the available allowances were sold. This increase in auction sales was accompanied by an increase in auction settlement prices above the floor price for the first time since 2015.
The change in market sentiment over the course of 2017 has been pronounced and appears to be driven in large part by increasing confidence in the future of the cap-and-trade program after resolution of legal challenges and progress on writing regulations to allow the program to continue after 2020. Structural tweaks to the program also appear to be boosting both market activity and prices. Finally, the fact that 2017 is the final year of the second compliance period probably also contributed to the strong demand for allowances once legal authority for the program was confirmed.
Looking forward, the beginning of a new compliance period, coupled with a continued surplus of allowances, could lead to a flattening of price escalation, or even short-term declines. However, developments over the course of 2017 appear to have laid the foundation for program stability and continued demand for allowances over the long term.
As discussed in more detail in the August 2016 NewsWire (“Uncertainty and Surplus Allowances Dog California Cap-and-Trade Program”), the California Air Resources Board (CARB) officially launched the cap-and-trade program in 2012, with mandatory compliance obligations beginning in 2013.
The program establishes an annual cap on California greenhouse gas emissions so as to reduce emissions to 1990 levels by 2020 and below this amount in subsequent years.
Entities covered by the program include electric utilities with retail loads, large industrial energy users, and, as of 2015, natural gas suppliers. Covered entities must submit an allowance to CARB for each metric ton of CO2-equivalent that they emit. The number of allowances available each year is equal to the number of metric tons of emissions that is allowed under that year’s cap.
Certain covered entities receive free allowances from CARB to cover a share of their emissions. For the electric utility sector, the amount of these free allowances was set to exceed the utilities’ allowance requirements, in recognition that utility customers have been paying for greenhouse gas emission reductions since before the start of the cap-and-trade program, such as through procurement of renewable resources and energy efficiency.
Investor-owned utilities are required to bid all their free allowances into state-run auctions, while other entities with surplus allowances may bid allowances into the auctions or sell them via the Intercontinental Exchange (ICE) trading market for California cap-and-trade allowances or via bilateral trades. Covered entities that do not receive allowances from the state or whose emissions exceed the allowances they are issued must buy allowances through one of these mechanisms. Entities without compliance obligations may also participate in the program by voluntarily reducing their own emissions or by trading allowances as a liquidity provider. The state also participates by offering a slate of allowances for sale into each auction to cover the anticipated allowance needs of covered entities while keeping the total number of allowances below the cap.
In 2014, Quebec linked its cap-and-trade program with California’s, and Ontario will do the same beginning in January 2018. Allowances issued for these programs may be used to comply with California cap-and-trade requirements, and vice versa, and the quarterly, state-run auctions cover allowances for all linked programs.
Uncertainty dogged California’s greenhouse gas cap-and-trade program throughout 2016 due to lawsuits questioning the legality of the program and uncertainty about the program’s future after 2020.
As a result of these uncertainties, as well as an oversupply of allowances available in the market, interest in allowances was weak during much of 2016 (Figure 1), and allowance prices remained at floor-price levels in the auctions and dropped below this level on the ICE secondary market (Figure 2).
Demand for allowances rebounded in the second quarter of 2017, and prices rose accordingly, with auction prices remaining above the floor price since the May 2017 auction.
The settlement price for the most recent auction, held on November 14, 2017, set a record high for the auctions at $15.06 per allowance, which is $2.33 higher than the settlement price throughout 2016. Moreover, ICE secondary market prices have generally remained higher than auction prices, with price premiums to purchase allowances on the ICE secondary market reaching up to about 11% above auction allowance prices. All told, California cap-and-trade allowance prices have been much stronger in 2017 than they were in 2016, with auction settlement price increases of about 18% from November 2016 to November 2017.
A number of factors came together to support the market recovery.
First, much of the legal and regulatory uncertainty surrounding the program was resolved over the course of 2017. Critically, a lawsuit challenging the legal basis for the program was rejected by the state appeals court, and the state supreme court declined to consider a further appeal, effectively ending the litigation. Adoption of new cap-and-trade legislation and regulatory amendments addressing the post-2020 program structure also provided important assurance about the program’s future.
Figure 2 highlights key legal, legislative and regulatory developments that bolstered the market over the past year.
Although market sentiment may be influenced by any number of factors, the steep increase in prices following the supreme court action upholding the legality of the cap-and-trade program suggests that the legal uncertainty had been depressing prices and demand for allowances. The new legislation and regulatory amendments that set the stage for the cap-and-trade program to continue to operate with ever-tightening allowance budgets each year through at least 2030 may also be contributing to near-term demand because allowances purchased today can be banked for future use as a hedge against prices that should rise over time as the supply of allowances is further restricted and the auction floor price is further increased.
Structural factors also contributed to the market recovery. In particular, given that 2017 is the last year of the 2015-to-2017 compliance period, all allowances for this three-year period must be procured by the end of the year. In 2015 and 2016, by contrast, entities had the option of not purchasing up to 70% of their compliance obligations for those years and instead waiting to see how the lawsuits or other factors played out. Some of the demand increase observed over the course of 2017 probably derives from entities that had been taking a wait-and-see approach and are now addressing unmet compliance obligations from 2015 and 2016 as well as meeting the current year’s obligations.
An additional structural influence contributing to the price recovery is a stabilizing mechanism that is in place to address surplus allowance conditions. In particular, allowances that are designated for auction by a greenhouse gas program regulator (currently, CARB or Quebec) and that are not sold are withheld from subsequent auctions and returned only after settlement prices in two consecutive auctions rise above the auction floor price. This mechanism led to removal of 153 million allowances from auctions in 2016 and 2017, helping to stabilize prices.
While the cap-and-trade allowance market experienced robust price increases in 2017, there are headwinds that could make it difficult for prices to sustain the upward momentum in 2018.
First, 2018 is the start of the third cap-and-trade program compliance period, which lasts from 2018 through 2020. Thus, allowance purchases could again largely be deferred until 2020 if compliance entities want to wait and evaluate future auction and secondary market prices before purchasing the full amount of allowances they require, perhaps due to cash-flow considerations or expectations of price declines.
Furthermore, in the near term, a large number of allowances that were auctioned by state agencies in previous auctions, but went unsold, will re-enter the market. This began to happen in November 2017. Per the regulations, the number of re-auctioned allowances was restricted to 25% of allowances previously designated for that auction, or about 16 million allowances, so as not to flood the market with too many allowances at once. This means, however, that the impact of this mechanism will continue over many more auctions, as 137 million additional allowances are awaiting re-entry.
To prevent these reintroduced allowances from depressing the market, beginning in January 2018, current-vintage allowances auctioned by state agencies that remain unsold for more than 24 months will be removed from the market and placed in an allowance price containment reserve fund, to be released back in the market only if prices rise to the point that action is needed to control allowance price increases.
Table A estimates the number of expiring allowances that will be removed from the market because they remain unsold for more than 24 months. Per this assessment, allowances will start to be permanently removed from the market in May 2018, with nearly 60 million allowances removed through February 2019. The removal of these allowances is not expected to have an immediate impact on pricing since allowances will also be reintroduced into the market over this same time period; however, removal will help to stabilize pricing in the intermediate term.
On balance, the start of a new compliance period in 2018 and the lingering impact of unsold allowances on auction results suggest that allowance prices could flatten or even pull back somewhat in 2018.
However, the certainty that the program will continue past 2020, thereby ensuring that allowances will continue to have value in the future, and the fact that excess allowances will eventually be removed from the market make it unlikely that prices will collapse back to levels seen in 2016 and early 2017. This is the case both with respect to auction prices, which are subject to annual floor price increases, and also with respect to secondary market prices, which are not subject to regulatory price controls.
Looking farther out, additional upward pricing pressure can be expected beginning around May 2019 after all the excess allowances from the 2016 and 2017 auctions have been dispensed with (either via reintroductions to earlier auctions or via removal from the market), and again during the second half of 2020 as the third compliance period draws to a close. Annual auction floor price increases and annual reductions to the total number of available allowances will also contribute to upward pricing pressure.
At this stage, regulations governing the cap-and-trade program after 2020 remain under development, but important steps were taken in 2017 to set the stage for the post-2020 program.
AB 398, passed by the California legislature and approved by Governor Jerry Brown in July 2017, extends the cap-and-trade program through 2030 with the goal of reducing the state’s greenhouse gas emissions to 40% below 1990 levels by 2030. In October 2017, CARB adopted annual emission allowance budgets for the years 2021 through 2030 consistent with this legislation, with declines in the number of allowances of about 5% per year.
Pursuant to AB 398, CARB will also establish price ceilings and intermediate price containment points below the price ceiling and will evaluate additional changes that may be made to the cap-and-trade program for the post-2020 period. For example, AB 398 directed CARB staff to address concerns about the potential over-allocation of allowances for 2021 to 2030, and CARB is seeking stakeholder feedback on this issue.
Going forward, the declining allowance budgets set by CARB in October 2017 should provide a tailwind for allowance prices by continuing to drive demand. However, the upside for prices could also be limited by the price ceiling and price containment measures that will be adopted by CARB. Overall, CARB’s many tools for steering allowance pricing — such as reducing allowance budgets over time, setting an auction price floor and ceiling, removing surplus allowances from the auctions and reintroducing them when prices are higher — aim for a long-term trend of steadily increasing prices without extended slumps or spikes.
Publication
It is widely accepted that 2023 was one of the worst years in recent memory for M&A activity.
Subscribe and stay up to date with the latest legal news, information and events . . .
© Norton Rose Fulbright LLP 2023